What should I know before investing in silver online?
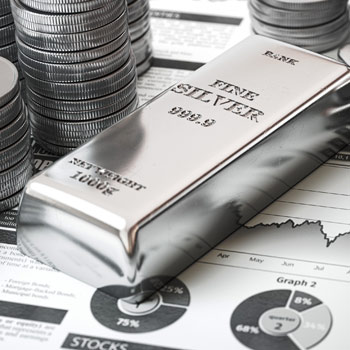
First of all, let's take a few moments to recall what stock market silver is and what is its history. It is of course a precious metal that is mainly used in industry, in the jewellery, goldsmith's and electronics sectors. Physical silver often takes the form of bars, coins or ingots and its price is quoted on the spot market, allowing investors to speculate on its price variations. In the financial markets, silver is found under the symbol XAG.
But if silver is a stock market asset in the strict sense of the word, it is also an indicator. Indeed, some economists use real-time graphs of stock market silver to predict global economic health. It is also common to think that silver can be used as a basic indicator to anticipate changes in other assets in different financial markets such as other commodities, stocks or currencies.
The history of this precious metal is very old and goes back thousands of years with the first mining exploitation estimated at 3000 BC. Over time and thanks to the strong popularity gained by this precious metal, silver mines multiplied all over the world and silver began to diversify its uses while increasing in value over the years. Thus, demand was so strong at the end of the 19th century that it was necessary to produce 120 million ounces each year to satisfy it.
However, it was not until the 1970s that silver became a stock market asset and therefore its price was quoted in real time. This precious metal entered the market at a price of $1.80 per ounce. The price of silver quickly increased in value and reached the $36 level in the early 1980s. But it quickly fell back to below $10, a level near which it would remain for almost twenty years. During the economic and financial crisis of 2008, the price of silver will however experience another upward phase with a peak at $20, but here again, the trend will quickly give way to a downward correction. Historically, the highest price of silver has been reached at nearly $50 per ounce following a reversal of the upward trend in 2011.
Trade silver online!{etoroCFDrisk}% of retail CFD accounts lose money - etoro.com
Historical analysis of silver prices on the stock market
Silver, a precious metal coveted for its beauty, conductivity and industrial properties, has had a chequered history in terms of price. Influenced by various factors such as supply and demand, inflation, geopolitical events and economic changes, its journey has been punctuated by peaks and troughs.
Here are some key milestones in the evolution of the price of silver:
Antiquity and the Middle Ages:
- Used as currency and to make art objects and jewellery, its price remained relatively stable, although varying according to region and time.
- Its ratio to gold was often around 15:1.
16th and 17th centuries:
- The discovery of silver deposits in South America increased supply and caused the price to fall.
- The ratio to gold reached 40:1.
19th century:
- Demand for silver for photography and industry contributed to a rise in price.
- The ratio with gold returned to around 15:1.
20th century:
- The nationalisation of silver mines and the discovery of new deposits increased supply and caused the price to fall.
- The historic peak of 50 dollars an ounce was reached in 1980.
- The price then trended downwards for several decades.
21st century:
- Silver prices surged, reaching a peak of $49 per ounce in 2011, fuelled by the global financial crisis and economic uncertainty.
- Since 2011, there has been a downward trend, but the price remains high by historical standards.
Here is a summary table of gold price trends over the last 10 years:
| Year |
Average annual price (USD/ounce) |
Annual change (%) |
| 2023 |
24.00 |
-3.8% |
| 2022 |
25.10 |
7.0% |
| 2021 |
23.50 |
-1.7% |
| 2020 |
23.85 |
48.3% |
| 2019 |
16.07 |
-15.7% |
| 2018 |
19.05 |
1.4% |
| 2017 |
18.78 |
7.3% |
| 2016 |
17.52 |
-12.2% |
| 2015 |
20.00 |
14.4% |
| 2014 |
17.45 |
-6.1% |
How do you analyse the price of silver before investing?
The fundamental analysis of live silver prices:
Fundamental analysis is, of course, one of the essential methods of analysis for trading in silver on the stock market and you must be able to detect and interpret external indicators that could raise or lower the price of this precious metal. To help you do this, here are a few examples of elements you can follow.
First of all, of course, the supply and demand for silver will be taken into account. To do this, we will monitor the countries that produce this raw material, such as China, Mexico and Peru. Of course, we will also study the importing countries that consume the most silver, such as the United States, the United Kingdom and India. It is the difference between supply and demand for silver that will have the greatest influence on the price of this metal. As far as demand is concerned, we will not forget to take into account the demand from industry, as silver is still often used today for its electrical conductivity and is therefore used in the composition of many products such as sustainable infrastructures, including photovoltaic panels. Similarly, silver is also highly sought after in the medical sector.
Some global economic data will also be closely monitored. During periods of strong economic growth, the price of silver tends to rise positively, thanks to an increase in the consumption of electronic products, jewellery and vehicles. However, silver prices may rise during periods of recession. This is partly due to the fact that, like gold, silver is considered by many investors to be a safe haven.
We can also look at the correlation between gold and silver. Indeed, the gold/silver ratio, which expresses the amount of silver needed to buy an ounce of gold, is also followed by many investors. Last year (2019), the discount between silver and gold was high at 90 ounces of silver for an ounce of gold. In fundamental analysis, a high ratio generally means that silver might be favoured by investors over precious metals because of its price. A low ratio, on the contrary, tends to make gold more attractive to investors.
Finally, the value of the US dollar can also be used in a fundamental analysis of the price of silver. Remember that silver is quoted in this currency. As a result, when the dollar is weak against other currencies, purchases from countries other than the US become more interesting with an advantageous exchange rate, which tends to increase demand. Conversely, a high dollar will slow down these purchases. Moreover, silver is often used as a hedging instrument in times of high inflation and many investors use it to cover their losses in the currency market.
Trade silver online!{etoroCFDrisk}% of retail CFD accounts lose money - etoro.com
Technical analysis of the silver price before investing
Technical analysis is the study of historical movements in the price of an asset, such as silver, to identify trends and potential patterns. This analysis can help investors make decisions about when to buy and sell in trading.
Here are some key factors to consider when performing a technical analysis of the silver price:
1. Trends:
- Identify bullish and bearish price trends over different time periods (short, medium and long term).
- Use indicators such as moving averages, Bollinger bands and MACD to confirm trends.
2. Support and resistance:
- Identify areas of support (where the price tends to bounce) and resistance (where the price tends to stop).
- Use these areas to determine potential entry and exit points.
3. Chartist patterns:
- Identify chartist patterns such as triangles, heads and shoulders, and flags that may indicate trend changes.
- Use these patterns to anticipate potential price movements.
4. Technical indicators:
- Use various technical indicators such as RSI, stochastics and volume to identify overbought/oversold areas and entry/exit signals.
- Combine several trading indicators for a more complete analysis.


